Does the phone you carry say something about how much you move? We think it does — and we have data to back it up.
In this work, we analyzed the movement patterns of over 50,000 smartphone users in a major European capital, using real network data from a mobile operator. Our finding: the tier of your smartphone — whether it’s a flagship or a budget device — is strongly linked to how much and how diversely you move around the city. This has practical consequences for how we build AI models that predict where people go next, and for whether those models treat everyone fairly.
We can explore diversity in mobility by measuring handover events
Every time you move around a city with your phone, your device silently switches between different mobile network antennas to maintain a connection. Each one of these switches is called a handover event. While handovers are invisible to users, mobile operators record them continuously — and together they trace out a picture of where your phone has been throughout the day.
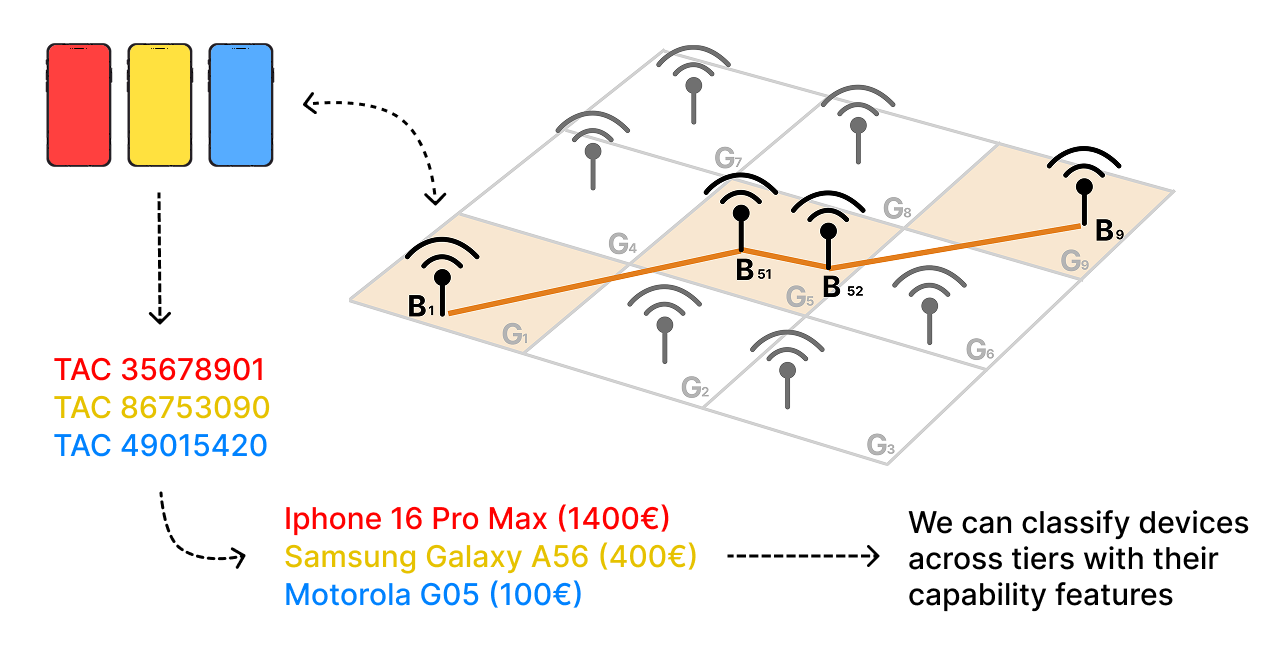
By mapping these handovers onto a geographic grid, we can reconstruct each user’s trajectory and calculate mobility indicators — statistics that describe how much and how unpredictably someone moves. We focus on two:
- Entropy: how random or unpredictable the trajectory is. Someone who always travels between the same two or three places has low entropy. Someone who visits many different spots across the city has high entropy.
- Radius of Gyration (RoG): how spread out the trajectory is around its center. A compact, neighborhood-level routine gives a small radius; a wider, city-spanning routine gives a large one.
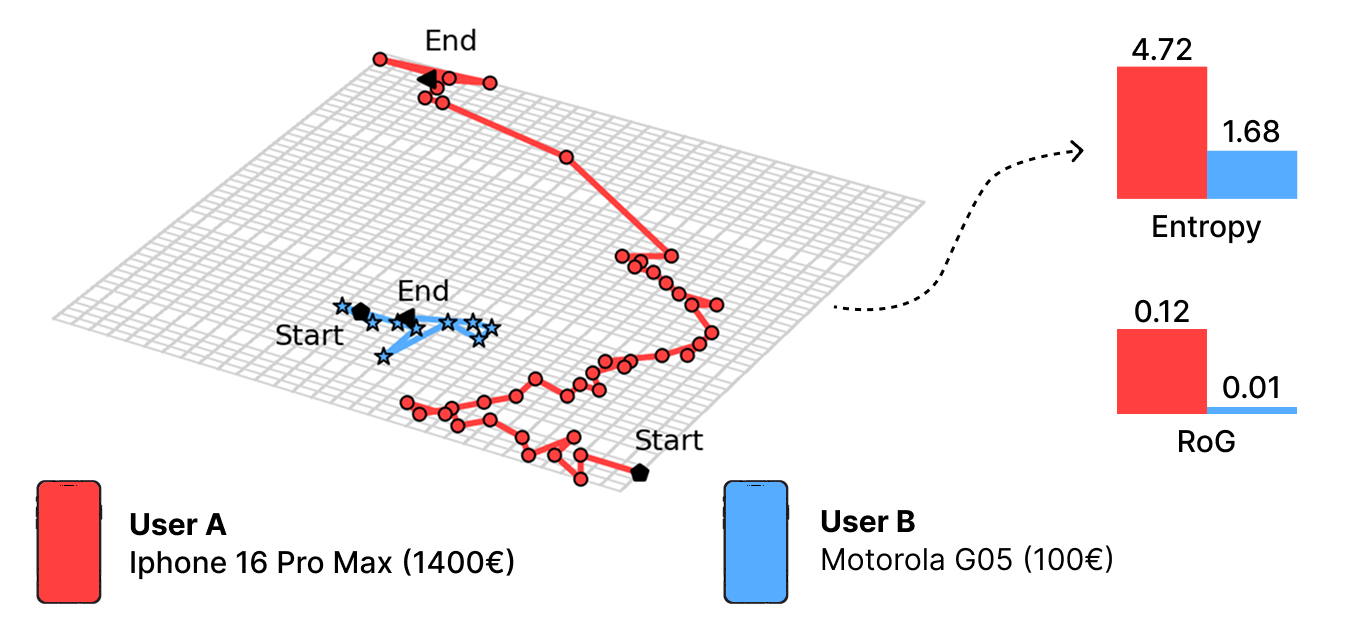
The difference becomes clear when you look at two example users. User A (linked to an iPhone 16 Pro Max) has a trajectory that visually looks larger and more diverse — confirmed by a higher Entropy (4.76) and Radius of Gyration (0.12). In contrast, User B (Motorola G05) follows a more compact routine, with lower Entropy (1.68) and RoG (0.01).
This is just one pair, of course. The real question is whether this pattern holds across tens of thousands of users. That’s what we set out to find out.
Devices are diverse, and their capability tiers can connect directly to their mobility patterns
The dataset: two weeks, one city, 50,000 phones
The data comes from a 14-day window (July 22 – August 4, 2024) of passively collected network signaling data from a major European mobile operator. We started with 80,000 randomly selected subscribers and filtered down to those who were actively present in the metropolitan area for at least 80% of the observation period. The final dataset covers 53,253 unique devices across 178 distinct smartphone models.
To classify devices, we didn’t just look at specs — we combined three dimensions into a single tier score: the age of the model, its estimated retail price (as of July 2024), and its Geekbench 6 multi-core benchmark score, a standard measure of raw computing power. This gave us three tiers:
| Tier | Models | Avg. age | Avg. price | Avg. Geekbench score |
|---|---|---|---|---|
| High | 41 | 21 months | €689 | 5,619 |
| Mid | 38 | 37 months | €344 | 3,248 |
| Low | 99 | 51 months | €117 | 1,376 |
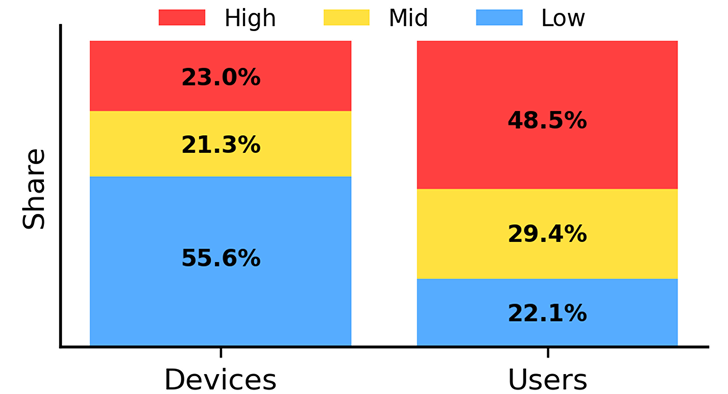
While most models fall into the Low tier (because there are simply more budget options on the market), the users tell a different story: almost half (48.5%) of the people in our dataset use High-tier devices, 29.4% use Mid-tier, and 22.1% use Low-tier phones. This bias toward premium devices reflects the study area — a high-income, cosmopolitan European capital.
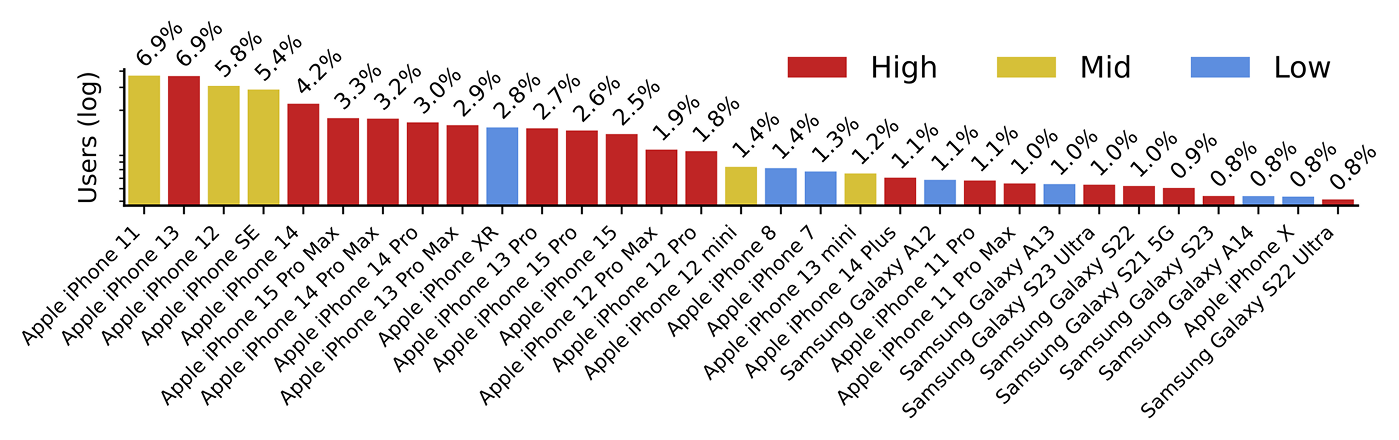
Looking at the most popular individual models, Apple’s flagship and Pro lines dominate, alongside Samsung’s S-series, followed by the Samsung A-series on the more affordable end.
Connecting mobility to device tier
For each of the 178 smartphone models, we calculated the median daily Entropy and RoG across all users of that model. We then ranked every model by each mobility indicator and looked at how device tiers distributed across those rankings.
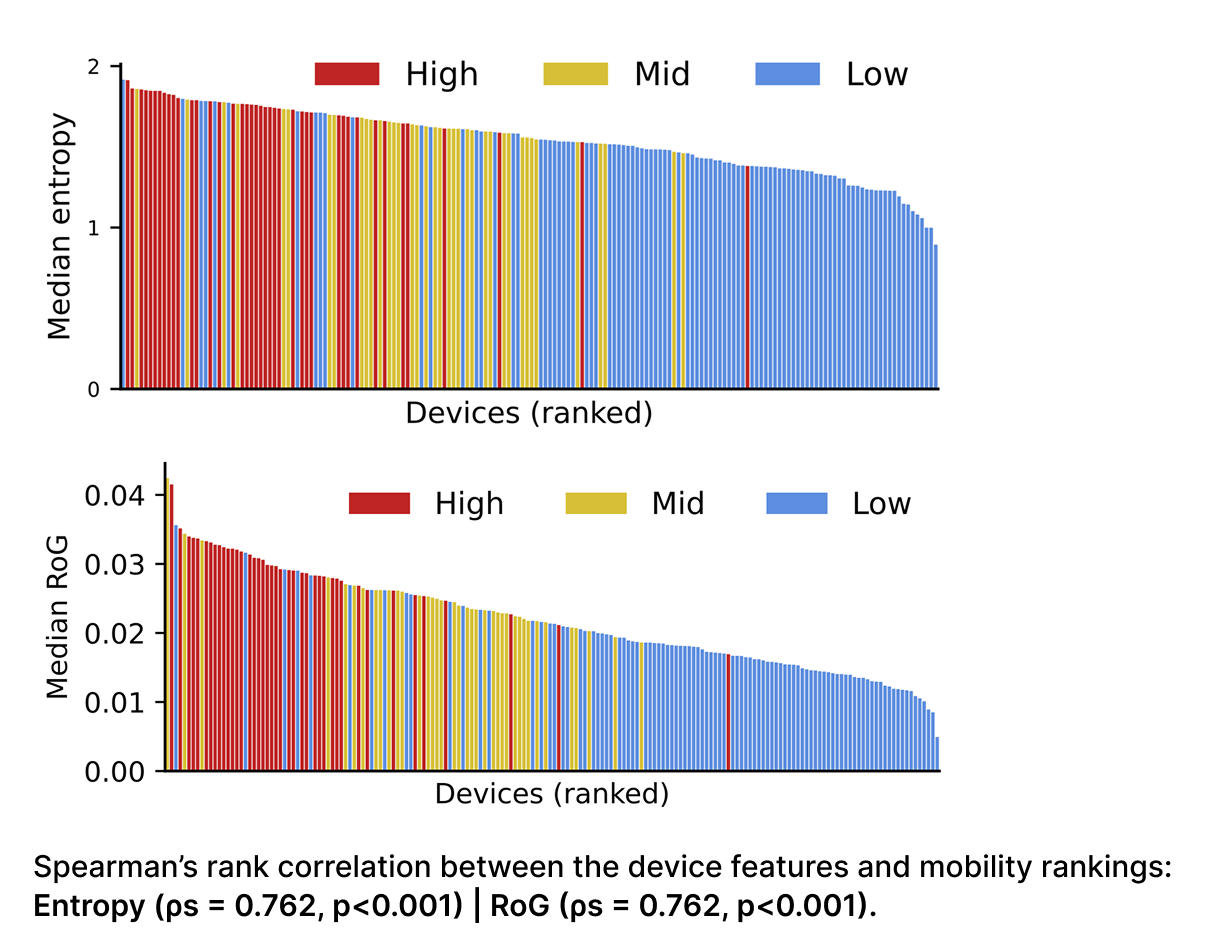
The pattern is striking: High-tier devices cluster at the top of the mobility rankings, and Low-tier devices cluster at the bottom. We confirmed this statistically using Spearman’s rank correlation — a measure that asks whether two rankings tend to agree. Both Entropy and RoG gave the same result: a strong positive correlation (ρ = 0.762, p < 0.001), meaning that as computational tier goes up, mobility tends to go up too, and this is not a coincidence.
To take this one step further, we used clustering algorithms to group the 178 models by their mobility profile alone — without using any device tier information — and then checked how well those mobility clusters aligned with the hardware tiers.
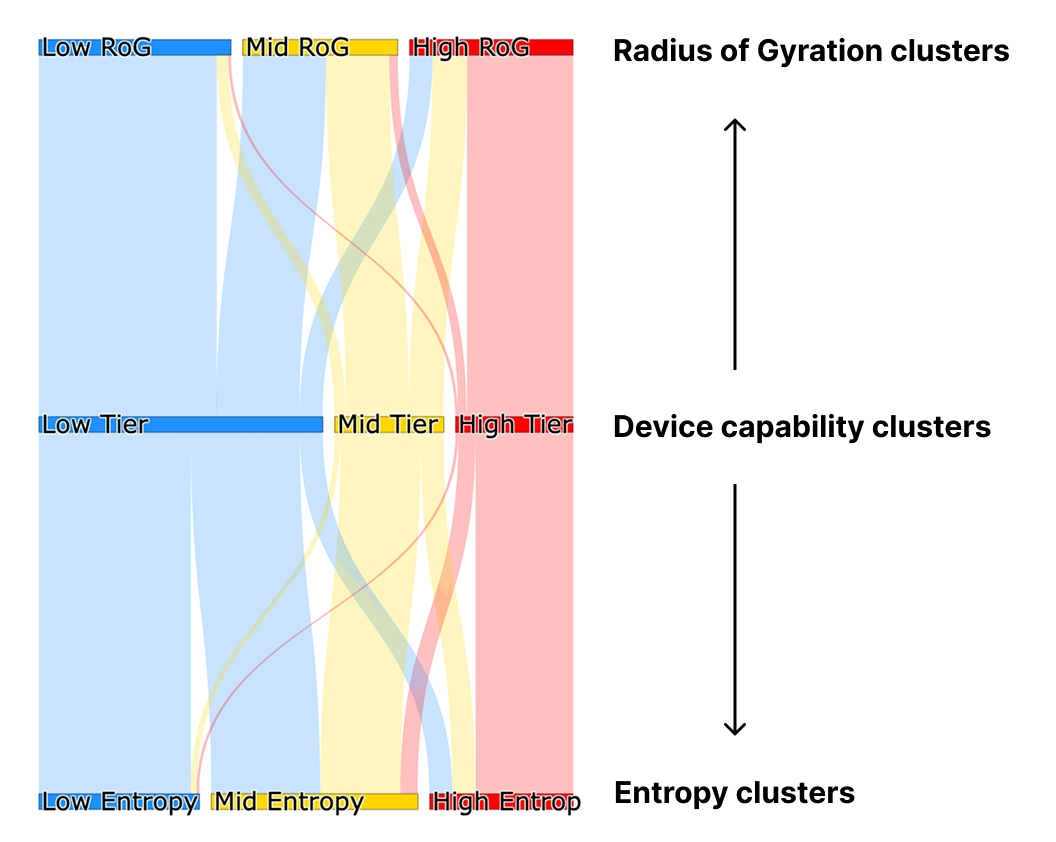
The alignment is clear: High-tier devices predominantly fall into High-mobility clusters, and Low-tier devices into Low-mobility ones. The middle cluster is the most mixed, absorbing most Mid-tier models and a significant slice of Low-tier ones. This ambiguity makes sense: the Low tier is a wide category. It includes both new, inexpensive phones and older flagship models — like the iPhone 8 or Samsung Galaxy J-series — that were once premium but are now outdated, and whose users tend to have more routine, sedentary movement patterns.
Interestingly, a small share of Mid-tier devices appear in the High-mobility cluster. Looking more closely, these tend to be so-called “budget flagship” phones — brands like Google Pixel A-series, Nothing, and Poco — that market themselves as premium-feeling devices at a lower price. Their users tend to be younger and more mobile, which helps explain the mismatch between hardware tier and mobility cluster.
Why this matters?
Hardware as a simple proxy for mobility
Determining how mobile a person is typically requires tracking their full trajectory over time — which is computationally expensive and privacy-sensitive. Our results suggest a shortcut: knowing what tier of phone someone uses is already a decent predictor of their mobility level, especially at the extremes (very mobile or very stationary users).
This could be useful in a range of real-world applications: network planning, load balancing across antennas, designing smarter handover strategies, and even informing services like navigation apps or ride-hailing platforms that benefit from understanding how users move.
Fairness in AI models that predict where you go next
The deeper implication of this work concerns how we build and train AI models for next-location prediction — systems that learn from movement patterns to predict where a user is likely to go next. These models are increasingly important for transportation, urban planning, and smart city infrastructure.
Training such models raises an immediate privacy concern: do you really want all your location data sent to a central server? A popular alternative is Federated Learning (FL) — a technique where each phone trains a small piece of the model locally, using only its own data, and only sends back summary updates (not raw trajectories) to be combined into a global model. The raw data never leaves your device.
The problem is that FL systems are often biased in subtle ways. Many FL training pipelines favor faster, more powerful devices to avoid “stragglers” — phones that take too long to compute their updates and slow everyone down. Since Low-tier devices are slower, they tend to be excluded from training. And since Low-tier devices are also the ones with lower mobility (as we’ve shown), the resulting model ends up trained mostly on data from highly mobile people — and may perform poorly for less mobile users, who represent 22.1% of the population in our study.
Our results suggest that smartphone tier could be used as a practical, easy-to-compute signal to guide client selection in FL, helping ensure that the training data represents the full range of mobility patterns — not just the most mobile users with the fastest phones. This is a step toward building AI systems that are accurate and fair.
We plan next to fully explore how this hardware-mobility link directly impacts an FL next-location prediction algorithm, and to propose concrete client selection techniques to improve fairness across the entire population.
A note on limitations
Our study is based on urban data from a single city. People in rural areas likely have different mobility patterns — for example, they may cover larger distances (higher RoG) but visit fewer distinct places (lower Entropy). We cannot yet say whether the same hardware-mobility link holds outside dense urban environments, and this is an important direction for future work.
📖 Reference
André F. Zanella, José Suárez-Varela, Andra Lutu, Jesus Omaña Iglesias
From Hardware to Handovers: Mapping Smartphone Tiers to Mobility Diversity
IEEE INFOCOM 2026 (Poster)